 Compliments of Oregon Climate Service
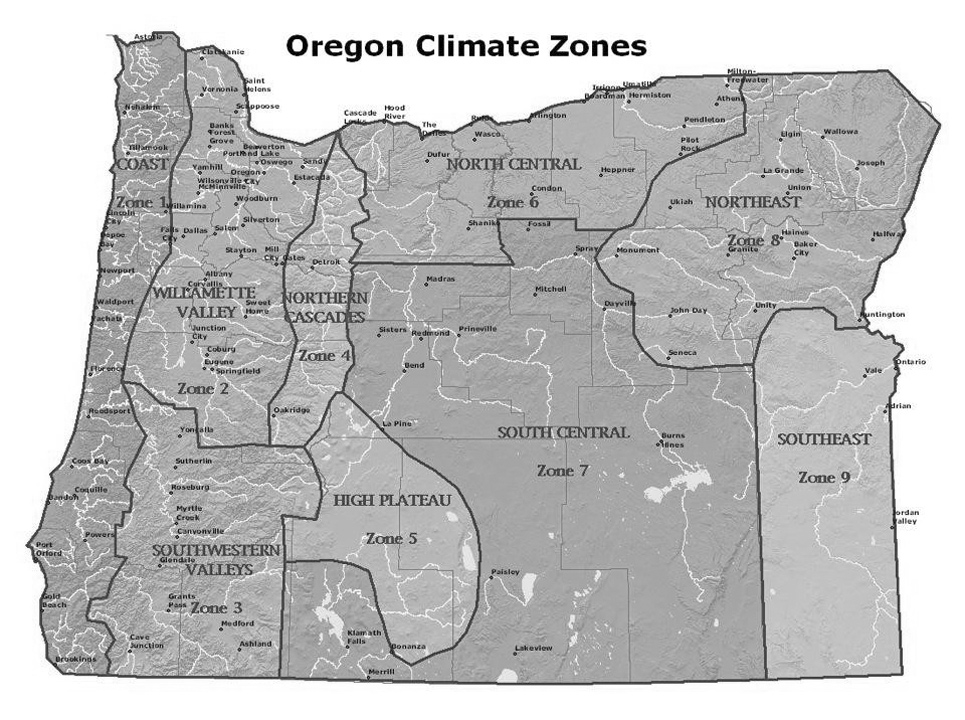
The precipitation map below reveals that the extremes from wet to dry within the boundaries of Oregon are truly astounding... Read on! ...The yellow and red tones generally denote the zones of Oregon which are drier and more sunny, in many cases, there is extreme aridity. East of the Cascade Mountains, yellow-red coloration brings with it winter snows and occasional sub-zero Arctic Cold Waves. The deep red tones denote very arid zones, such as the area around Redmond in Central Oregon, which receives only about 8 inches of rain per year... Rainfall drops even further in the far southeastern corner of Oregon, with such places as Rome, Burns Junction (on Hwy 95), and the Alvord desert dessicating with only 6-7 inches a year. My pick for Oregon's driest (tiny) town is Fields, in the rain shadow of the Steens/Pueblo Mountains, receiving only 6.4 inches per year (Portland receives very nearly that much in a single winter month!)...My research indicates that Fields also holds Oregon's record for the driest-ever year, that being 2002, with a bare 2.56 inches of rain falling in the course of the entire year....Oregon can also occasionally be subject to extreme snow droughts, the worst of which was probably the winter of 1976-77.......... Please examine the map below, then click for a satellite photo, which shows you a very typical Oregon cloudiness pattern.
Oregon Precipitation zones * Compliments of Oregon Climate Service
The Southern Oregon Coastal strip around Brookings is a winter Banana Belt, where temperatures can soar up toward 70 degrees in January, and frost is virtually unknown...Yet in the summertime, this zone is consistently almost chilly, daily highs often not exceeding 65!
35-50 inches per year--- Oregon's major population center, the Willamette Valley, is mild and generally cloudy year-round, with ample rainfall in the range of 35 to 50 inches per year, and only one or two minor snowfalls per winter. The mental health illness of "seasonal affective disorder," which is basically depression over the persistent rain and gloom, is nicknamed "SAD." SAD was first identified and researched in the Willamette Valley, please click the following link to see why-- it's about the Gloom of Spring 2003 and heat wave of April 2004 (new records set!) --- Luckily for SAD sufferers, most years have a prounounced 2-3 month drier, sunnier period in the summertime, with occasional heat waves with highs of 90 to 100 degrees. But sometimes, not, see also Gloomy Spring 2005.
120-150 inches per year--- Areas of the Coast Range, such as Laurel Mtn and Valsetz, are extraordinarily wet, with yearly rain amounts around 120-150 inches. My pick for Oregon's wettest town is the small company-owned mill town of Valsetz, which during the period of record of 1926 to 1986, averaged 128 inches per year! It would take Oregon's driest town, Fields, twenty years to get that much rain! Not surprisingly, when the mill pulled out of Valsetz around 1985, no one wanted to keep living there, and so the weather station closed down. Valsetz was located in a small valley at 1,150 feet, about 30 miles inland from Lincoln City on the Oregon Coast. Nowadays, I nominate Tillamook for the title. It's a real town, located on the northern Oregon coast, famed for its cheese-making industry. Tillamook is drenched with an honest 90 inches per year.
YEARLY: 204 inches of Rain! In 1996, 3,589 ft. Laurel Mountain west of Salem set a new state rainfall record of 204 inches in a single year! MONTHLY: 49.59 inches-- And in November 2006, Laurel set a new monthly rainfall record for Oregon, a monstrous 49.59 inches--- that's over four FEET of rain falling in a single month, which is an average of over 1 1/2 inches falling each and every day for a solid month! (Portland's wettest-ever month recorded a mere 13.35 inches (December 1996). IN A SINGLE DAY: 14.30 inhes-- Nov. 6, 2006: Lees Camp near the Wilson River east of Tillamook received 14.30 inches of rain on Nov. 6. The rains flooded houses and businesses in Tillamook, undermined million-dollar homes on the coast and also inland on the Sandy River, and caused a major washout of Oregon 35 near Mount Hood.
Year-round, Oregon hides some amazingly hot spots.
Banana Belt--- During the colder six months, the Southern Oregon Coast amazes Oregonnians and tourists alike with a unique Banana Belt which centers around the town of Brookings, with its renowned "Brookings Effect" and motto of "Winter Flowers."
During the 4-6 months centering on Oregon's actual summer, other parts of the State put to shame the State's otherwise fine reputation for being green and mild.
The scorcher towns and villages of summer hide out in scattered areas around the State, with the consistently hottest areas lying in Southern Oregon's Rogue River Valley; in the Pendleton region of Northeast Oregon; along the Idaho border/Snake River Canyon in the area of Ontario and Huntington; and in scattered river valleys in North Central Oregon, ie. perennial hot spots such as The Dalles, Spray, Kimberly, Pelton Dam near Madras, and Warm Springs........
All of these areas have extended periods of time with dry, very hot weather with highs of 95-105, and occasionally over 110 degrees! If the area involved has a lake, it will be one of Oregon's best spots for water sports, ie. Lake Billy Chinook in the Madras region.
Click here to view a list of state record hot days in every month of the year! Hot Days in Oregon!
Personal Note: As a boy growing up in the Rogue River Valley, this photographer remembers playing outside one mid-June day when the 109 degree heat made the asphalt so hot it sucked off one of his sandals! ..More recently, Medford recorded 111 degrees on August 6, 1981, assuring its title as Oregon's hottest major city .....Oregon's hottest small town that is a true incorporated town is probably Huntington, population 520 near the Idaho border...Click now to see a current State Highway cam picture from the I-84 Weatherby Rest Area on the banks of the Snake River near Huntington.
Oregon also cracks national summertime low temperatures on a daily basis in an odd little icebox south of Bend in Central Oregon. Here, small communities nestled in the lodgepole pines such as LaPine, Crescent and Fremont (near Fort Rock) regularly see frost all summer long, occasionally even hard frosts well below 25 degrees F, in the very heart of summer! Take a look at the "US 97 LaPine" cam when you visit the State Highway Department's live highway camera link on the Oregon Map page!
It's publicly-known that winds in Oregon and Washington can be severe on coastal headlands and exposed mountains in the Coast Range. Perhaps best-known is Mt. Nebo, 3,154 ft high in the Oregon Coast range near Tillamook. Any strong winter storm front can generate winds approaching 100 mph on Hebo.... However, what is not well-known is that similar wind strengths are also common on Oregon and Washington peaks of the high Cascade Range, and at narrow points within the Columbia River Gorge such as Crown Point. Most notable of the mountain sites is Camp Muir, an instrumented climber's refuge at 10,100 feet on Mt. Rainier's southern side. At Muir, "any old" winter storm is likely to create stats such as this: Feb. 5, 2016, 6 p.m., wind average 102 mph with gusts to 118 mph. And on the upper reaches of Oregon's Mt. Bachelor Ski Resort, the mid-mountain gauges hit 118 mph on January 21, 2016. Furthermore, reliable reports from the same location on Mt. Bachelor describe highly destructive winds up to 176 mph before the gauge was destroyed! In case such strong winds are difficult to believe, note that the World's strongest surface wind speeds are much stronger; the record has also been on a mountaintop, the 6200 ft. summit of Mt. Washington in New Hampshire, with a record of 231 mph in 1934. Here's a tornado resource brought to my attention by an Oregon student: www.safestars.org/tornado-safety
There is not another State in the United States that encompasses so many extremes of temperature, rainfall and sunshine within such modest geographical boundaries.
"The Oregon Weather Book," .by George Taylor and Raymond R. Hatton .(with photos and other contributions by this writer)....
Here's a picture of a copy
of my book that I happened to find in actual use in a remote Forest
Service lookout tower in Eastern Oregon.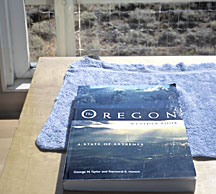
Update: the companion volume to the above is now available, also sporting cover photography by this photographer... It is titled "The Climate of Oregon," by George Taylor and Chris Hannan.
* Precipitation Map Image compliments George Taylor, State Climatologist for Oregon (as of 2008. 2023, now so sadly deceased)